Cartographie du gel saisonnier du sol en zone de taïga à partir d’images RSO de RADARSAT-1 et SSM/I de DMSP F-8
Résumé
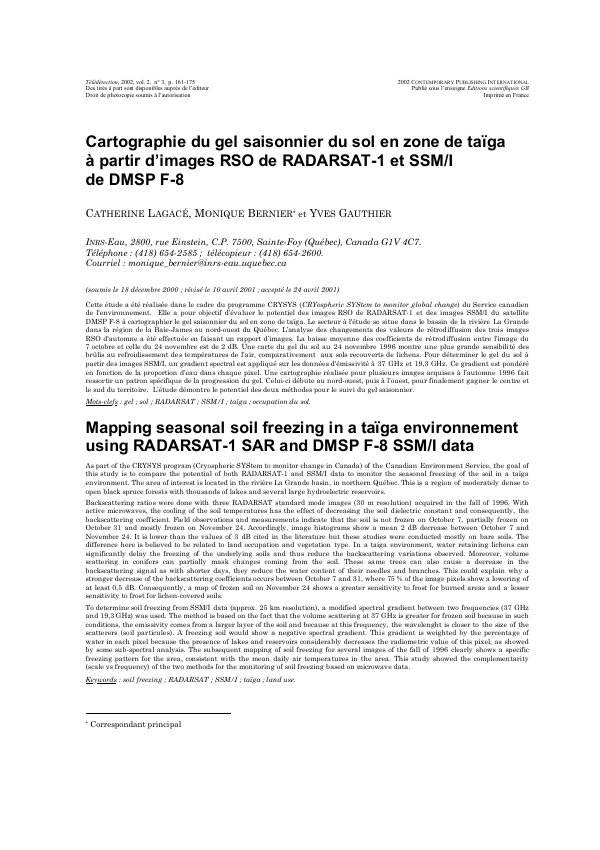
Cette étude a été réalisée dans le cadre du programme CRYSYS (CRYospheric SYStem to monitor global change) du Service canadien de l'environnement. Elle a pour objectif d’évaluer le potentiel des images RSO de RADARSAT-1 et des images SSM/I du satellite DMSP F-8 à cartographier le gel saisonnier du sol en zone de taïga. Le secteur à l'étude se situe dans le bassin de la rivière La Grande dans la région de la Baie-James au nord-ouest du Québec. L’analyse des changements des valeurs de rétrodiffusion des trois images RSO d'automne a été effectuée en faisant un rapport d’images. La baisse moyenne des coefficients de rétrodiffusion entre l’image du 7 octobre et celle du 24 novembre est de 2 dB. Une carte du gel du sol au 24 novembre 1996 montre une plus grande sensibilité des brûlis au refroidissement des températures de l’air, comparativement aux sols recouverts de lichens. Pour déterminer le gel du sol à partir des images SSM/I, un gradient spectral est appliqué sur les données d'émissivité à 37 GHz et 19,3 GHz. Ce gradient est pondéré en fonction de la proportion d’eau dans chaque pixel. Une cartographie réalisée pour plusieurs images acquises à l’automne 1996 fait ressortir un patron spécifique de la progression du gel. Celui-ci débute au nord-ouest, puis à l’ouest, pour finalement gagner le centre et le sud du territoire. L’étude démontre le potentiel des deux méthodes pour le suivi du gel saisonnier.
Abstract
As part of the CRYSYS program (Cryospheric SYStem to monitor change in Canada) of the Canadian Environment Service, the goal of this study is to compare the potential of both RADARSAT-1 and SSM/I data to monitor the seasonal freezing of the soil in a taïga environment. The area of interest is located in the rivière La Grande basin, in northern Québec. This is a region of moderately dense to open black spruce forests with thousands of lakes and several large hydroelectric reservoirs. Backscattering ratios were done with three RADARSAT standard mode images (30 m resolution) acquired in the fall of 1996. With active microwaves, the cooling of the soil temperatures has the effect of decreasing the soil dielectric constant and consequently, the backscattering coefficient. Field observations and measurements indicate that the soil is not frozen on October 7, partially frozen on October 31 and mostly frozen on November 24. Accordingly, image histograms show a mean 2 dB decrease between October 7 and November 24. It is lower than the values of 3 dB cited in the literature but these studies were conducted mostly on bare soils. The difference here is believed to be related to land occupation and vegetation type. In a taiga environment, water retaining lichens can significantly delay the freezing of the underlying soils and thus reduce the backscattering variations observed. Moreover, volume scattering in conifers can partially mask changes coming from the soil. These same trees can also cause a decrease in the backscattering signal as with shorter days, they reduce the water content of their needles and branches. This could explain why a stronger decrease of the backscattering coefficients occurs between October 7 and 31, where 75 % of the image pixels show a lowering of at least 0,5 dB. Consequently, a map of frozen soil on November 24 shows a greater sensitivity to frost for burned areas and a lesser sensitivity to frost for lichen-covered soils.
To determine soil freezing from SSM/I data (approx. 25 km resolution), a modified spectral gradient between two frequencies (37 GHz and 19,3 GHz) was used. The method is based on the fact that the volume scattering at 37 GHz is greater for frozen soil because in such conditions, the emissivity comes from a larger layer of the soil and because at this frequency, the wavelenght is closer to the size of the scatterers (soil particules). A freezing soil would show a negative spectral gradient. This gradient is weighted by the percentage of water in each pixel because the presence of lakes and reservoirs considerably decreases the radiometric value of this pixel, as showed by some sub-spectral analysis. The subsequent mapping of soil freezing for several images of the fall of 1996 clearly shows a specific freezing pattern for the area, consistent with the mean daily air temperatures in the area. This study showed the complementarity (scale vs frequency) of the two methods for the monitoring of soil freezing based on microwave data.
Lire l’article
PDF de 15 pages, tel qu’imprimé dans la revue, pages 161 à 176. En libre accès.
Pas encore de consultation enregistrée.